|
|
[Last Modified: ] |
|
|
|
| [Plasmodium
falciparum] [Plasmodium malariae] [Plasmodium ovale] [Plasmodium vivax] |
|
|
|
|
|
|
|
|
While morphologic characteristics provide valuable criteria for determination of malaria parasite species, they occasionally fail to differentiate between species that share morphologic characteristics (especially Plasmodium vivax and P. ovale) or in cases where parasite morphology has been altered by drug treatment or improper storage of the sample. In such cases, molecular diagnostic tests can provide useful complementary information. In addition, molecular tests can be more sensitive and their interpretation is less open to subjectivity than microscopy. The method currently used at CDC is described below.
Species-specific
PCR diagnosis of malaria
Plasmodium genomic
DNA is extracted from 200 µl whole blood using the QIAamp Blood Kit (Cat.
No. 29106; Qiagen Inc., Chatsworth, CA.) or a similar product that can
yield the comparable concentration of genomic DNA from the same volume
of blood.
Detection and speciation of Plasmodium is done with a two step nested PCR using the primers of Snounou et al. In the first step (PCR1), 1 µl of extracted DNA is amplified using genus specific primers; in the second step (PCR2), 1 µl of PCR1 amplification product is further amplified using species specific primers. Ten µl of each PCR2 amplified DNA product is separated by 2% agarose gel electrophoresis, stained for 15 min with ethidium bromide and visualized by UV illumination.
 |
| A |
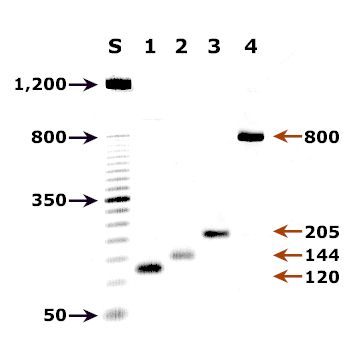
A: Agarose gel (2%) analysis of a PCR diagnostic test for species-specific detection of Plasmodium DNA. PCR was performed using nested primers of Snounou et al.1
- Lane S: Molecular base pair standard (50-bp ladder). Black arrows show the size of standard bands.
- Lane 1: The red arrow shows the diagnostic band for P. vivax (size: 120 bp).
- Lane 2: The red arrow shows the diagnostic band for P. malariae (size: 144 bp).
- Lane 3: The red arrow shows the diagnostic band for P. falciparum (size: 205 bp).
- Lane 4: The red arrow shows the diagnostic band for P. ovale (size: 800 bp).
Reference:
Snounou G, Viriyakosol S, Zhu XP, et al. High sensitivity detection of human malaria parasites by the use of nested polymerase chain reaction. Mol Biochem Parasitol 1993;61:315-320.
|
|||